

.jpg)
.jpg)


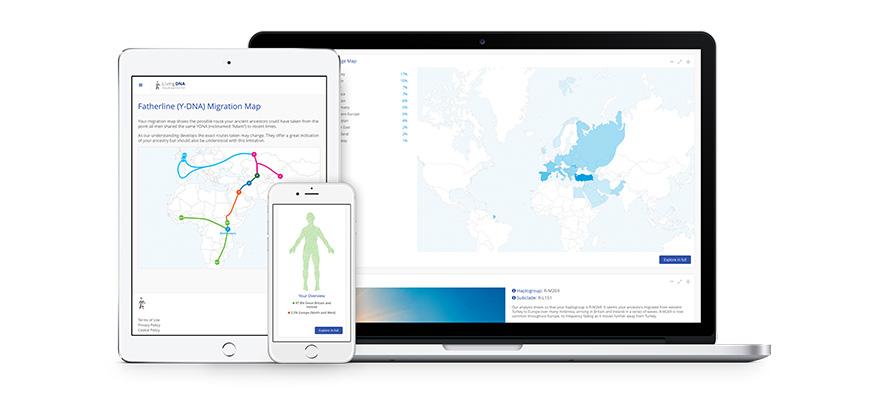
3-in-1 ancestry test from Living DNA
Family Ancestry
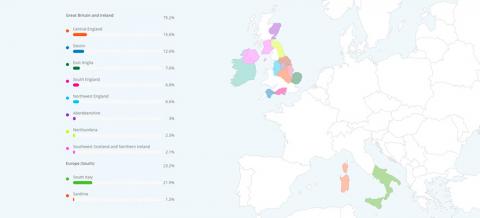
- Your recent ancestry from all side of your family broken down across up to 80 worldwide regions
- Optional personalised ancestry book
- Interactive online results
- Developed with world leading academics
Fatherline Ancestry
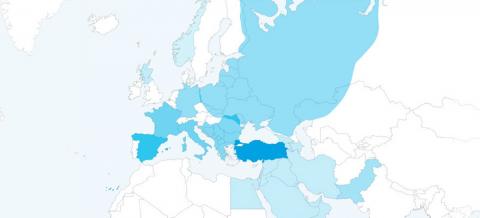
- The history of your fatherline up until recent times
- The most technically advanced fatherline ancestry test
- Fatherline ancestry is only possible for men, as they carry the Y chromosome
- Looks at over 21,000 areas of your Y chromosome
Motherline Ancestry
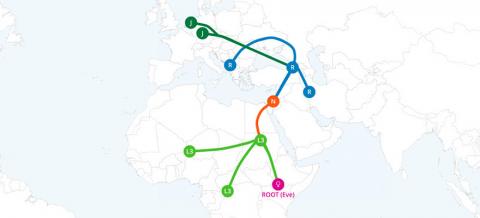
- The history of your motherline up until recent times
- The most technically advanced motherline ancestry test
- Looks at over 4,000 areas of your mtDNA